Ghibli and Generative AI: How Storytelling Enhances AI-Generated Insights
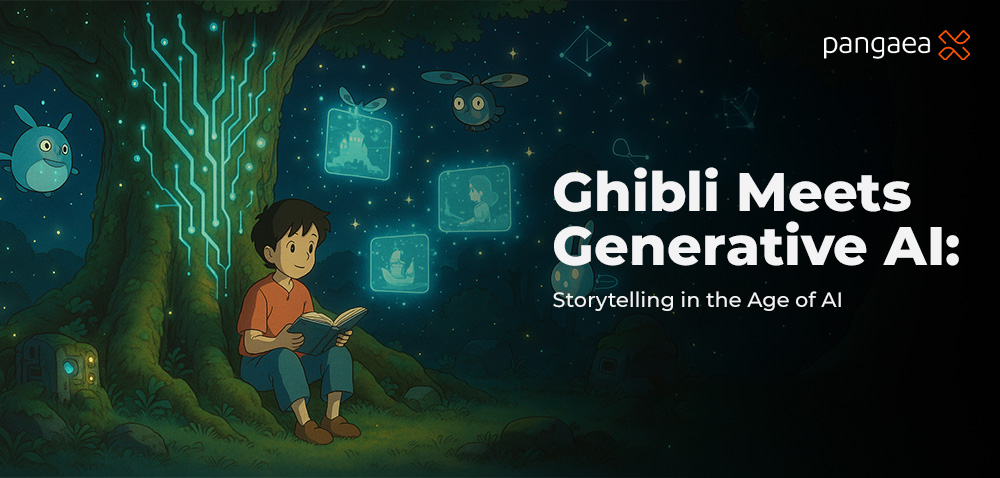
Imagine stepping into the lush, whimsical world of My Neighbor Totoro—a place where soft greens and warm golds weave stories of wonder and heart. Now, picture that same magic transforming a data dashboard, making sales trends or customer insights as captivating as a Studio Ghibli film. Thanks to the viral Ghibli AI trend, where tools like ChatGPT, Grok 3, and MidJourney create Ghibli-style images from simple prompts, this vision is closer than ever. But here’s the real magic: Ghibli’s storytelling doesn’t just inspire AI art—it can revolutionize data science, data analysis, and data visualization, especially for freelancers looking to stand out.
In this post, we’ll explore how the Ghibli AI trend from ChatGPT’s Ghibli-fied selfies to MidJourney’s anime landscapes—offers lessons for crafting AI-generated insights that resonate. We’ll dive into Ghibli’s storytelling principles, show how generative AI enhances data work, and share practical tips for freelancers to leverage this trend. Whether you’re a data scientist, analyst, or visualization expert, you’ll discover how to blend Ghibli’s narrative charm with AI to create insights that inform and inspire. Ready to embark on this journey? Let’s find out what Ghibli and AI can teach us about telling better data stories.
The Ghibli AI Trend: A Cultural and Technical Phenomenon
The Rise of Ghibli AI Art
If you’ve scrolled through X or Instagram lately, you’ve likely seen it: a friend’s selfie reimagined as a Spirited Away character or a cityscape transformed into a Ghibli-style forest glowing with pastel hues. This Studio Ghibli AI art trend has taken the internet by storm, fueled by generative AI tools like ChatGPT’s GPT-4o, xAI’s Grok 3, Google Gemini, and MidJourney. Users type prompts like “turn my photo into a Ghibli scene” or upload images, and within seconds, AI delivers stunningly accurate renditions of Ghibli’s iconic aesthetic.
Why Ghibli?
So, why is everyone obsessed with the Studio Ghibli images that ChatGPT and other platforms churn out? It’s more than nostalgia. Ghibli’s films, from Howl’s Moving Castle to Princess Mononoke, blend intricate details with emotional depth. Their soft colors, hand-drawn textures, and evocative landscapes feel alive, pulling viewers into stories of courage, nature, and humanity. Generative AI captures this magic with uncanny precision, thanks to advanced models trained on vast visual datasets. For data scientists, this mirrors a key challenge: how do you take complex data and make it as clear and compelling as a Ghibli scene?
The Tech Behind the Trend
At its core, the Ghibli AI trend relies on generative AI and data science principles. Tools like MidJourney use diffusion models to refine random noise into coherent images, while multimodal AI (like GPT-4o) processes text and visuals together. It’s not unlike how data scientists use AI to sift through messy datasets, uncovering patterns that tell a story.
This parallel hints at a bigger idea: just as AI can mimic Ghibli’s art, it can help craft AI visualization trends that make data insights unforgettable.
Visual Inspiration
Imagine a Ghibli-style forest, where each tree gently glows with data points , sales figures, perhaps—illuminating a journey through business growth. This scene beautifully illustrates the future of data visualization, where insights guide viewers as effortlessly as characters move through Ghibli’s whimsical landscapes.
Storytelling in Data Science: Lessons from Ghibli
Studio Ghibli doesn’t just tell stories; it weaves experiences that linger. Whether it’s Chihiro’s journey in Spirited Away or Totoro’s quiet moments of wonder, Ghibli’s films teach us how to connect with audiences. Data scientists can borrow these principles to elevate data storytelling, AI, and create visualizations that stick.
Emotional Connection
Ghibli’s films evoke universal feelings—joy, longing, and resilience. When Totoro leaps onto a spinning top, we feel childlike wonder; when San fights for her forest, we sense her fierce determination. Data visualizations should do the same. A bar chart of customer churn might seem dry, but frame it as a “journey” of lost connections, and it hits harder. By tapping into emotions, data scientists can make stakeholders care about the numbers.
Simplicity in Complexity
Ghibli tackles big themes, environmentalism, identity, war—yet distills them into stories kids and adults grasp. Princess Mononoke weaves a tale of gods and humans in conflict, but its core message is clear: balance matters. Similarly, Ghibli-inspired data visualization simplifies complex datasets without losing depth.
Visual Harmony
Every Ghibli frame is a work of art, lush forests, glowing skies, intricate details that feel cohesive. This harmony is a model for data visualization with AI. A well-designed dashboard, with soft colors and intuitive layouts, invites exploration, much like Ghibli’s worlds.
Putting It Into Practice
Start with narrative-driven insights. Frame your analysis as a story: a retailer’s revenue dip might be “a village facing a storm,” with recovery steps as “rebuilding under clear skies.” Next, use AI tools to design charts with Ghibli-like aesthetics—rounded edges, warm tones, or animated transitions. Finally, add contextual depth. Like Ghibli’s layered narratives, explain the “why” behind trends.
Visual Inspiration
Sketch a dashboard inspired by Ghibli’s style, flowing lines, soft greens, a touch of whimsy. How would it change how you present data?
How Generative AI Enhances Data Science with Storytelling
The Ghibli AI trend isn’t just about pretty pictures; it shows how generative AI insights can transform data work.
AI-Powered Data Insights
Generative AI, like ChatGPT or Grok 3, excels at finding chaotic patterns. Feed it a dataset of customer purchase histories, for example, and it can summarize trends, predict behaviors, or write narrative reports. It’s data storytelling powered by AI.
Enhanced Visualizations
AI can design Ghibli-style charts that pop. Tools like Tableau, integrated with AI plugins, or Python libraries like Matplotlib and Seaborn can mimic Ghibli’s pastel palettes, creating charts that feel alive.
Storytelling Automation
AI automates data science storytelling tools, turning raw metrics into a story: “Your customers wandered through a quiet season, but new campaigns lit up their path.”
A Real-World Example
Picture a data scientist using AI to analyze customer behavior, then presenting findings in a Ghibli-inspired data visualization—a dashboard styled like a glowing village, where each shop represents a product category.
Visual Inspiration
Picture a revenue chart styled as a flowing river, winding through a vibrant landscape. The movement and color gradients naturally guide stakeholders through data insights.
Ethical Considerations in Ghibli AI and Data Science
As enchanting as the Ghibli AI trend is, it comes with ethical questions, especially around AI ethics in data science. Ghibli’s own Hayao Miyazaki once called AI art “an insult to life itself,” criticizing its lack of soul. Data scientists must navigate similar concerns to use AI responsibly.
Ghibli AI Concerns
Creating Studio Ghibli AI art raises copyright risks. AI models trained on Ghibli’s films may replicate protected designs, sparking legal debates. This mirrors data privacy concerns: just as Ghibli’s art deserves respect, so does user data in AI models.
Data Science Parallels
In data science, ethics means transparency and consent. Using customer data without permission is like copying Ghibli’s style without credit—it erodes trust. Best practices include anonymizing data and prioritizing originality.
Balancing Creativity and Responsibility
Ghibli’s craftsmanship reminds us to innovate with care. By respecting data privacy and intellectual property, we honor the human spark that makes both Ghibli and data science meaningful.
Tools and Tips to Create Ghibli-Inspired Data Visuals
Ready to bring Ghibli’s magic to your data projects? Here’s a toolkit and practical tips to create AI tools for data visualization that channel Studio Ghibli’s aesthetic, whether you’re a beginner or a pro.
AI Tools for Ghibli-Style Visuals
- ChatGPT (GPT-4o): Generate inspiration with prompts like “design a pastel-colored forest chart.” While image outputs are limited, it sparks creative ideas.
- Grok 3: Free on grok.com, Grok 3 integrates with X for quick Ghibli-style mock-ups. Try “visualize data as a Ghibli meadow” for stunning results.
- MidJourney / Stable Diffusion: These platforms excel at AI visualization, offering high-fidelity anime-inspired designs for dashboards or reports.
- Canva / Fotor: Enhance AI-generated images with Ghibli-like filters—soft gradients and hand-drawn textures—for polished presentations.
Data Visualization Tools
- Tableau / Power BI: Customize dashboards with flowing designs and warm colors, mimicking Ghibli’s harmony.
- Python (Matplotlib / Seaborn): Code Ghibli-style charts with pastel palettes and rounded edges. A simple script can turn a bar chart into a glowing village skyline.
- D3.js: Build interactive visuals that animate like Ghibli scenes—think data points drifting like fireflies.
Practical Tips
- Craft Descriptive Prompts: Tell AI, “Visualize sales data as a Ghibli-style village with glowing lights.” Specificity yields better results.
- Focus on Emotional Impact: Choose colors (soft pinks, greens) and layouts that evoke warmth or curiosity.
- Test with Stakeholders: Ensure your visuals clarify insights without overwhelming, just like Ghibli’s clear storytelling.
Visual Inspiration
Imagine a heatmap styled like a Ghibli sunset—warm reds fading to cool blues, with data points as twinkling stars. Try coding one in Python or sketching it in Canva.
How Freelance Data Scientists and Visualization Experts Can Leverage the Ghibli AI Trend
For freelance data scientists and data visualization experts, the Ghibli AI trend is more than a creative fad—it’s a game-changer. In a crowded market, clients crave deliverables that stand out, and Ghibli’s storytelling offers a unique edge.
Why Ghibli Matters for Freelancers
Clients want insights that stick. Ghibli’s emotional, visual appeal makes complex data memorable, helping freelancers deliver Ghibli-inspired data visualization projects that wow. Plus, the trend’s buzz—think viral ChatGPT data storytelling posts—gives freelancers a conversation starter to showcase creativity on platforms like Upwork or LinkedIn.
Practical Applications
- Client Presentations: Use AI tools like Grok 3 or MidJourney to craft data storytelling for freelancers. For a marketing client, visualize campaign results as a Ghibli-style festival, with each booth representing a channel’s performance.
- Portfolio Building: Create a niche in AI visualization portfolio work. Design a sample project like a Ghibli-fied customer journey map and feature it on your website.
- Social Media Branding: Share Ghibli-style charts on X or Instagram to build a following.
Example: A freelancer used MidJourney to create a churn analysis for an e-commerce client, styled as a Ghibli village where fading lights showed lost customers. The client loved the narrative framing, hiring her for more gigs.
Upskilling Opportunities
To stay competitive, learn freelance data scientist AI tools. Experiment with ChatGPT for ideation, Python for custom visuals, or Flowimmersive for AR/VR dashboards.
Standing Out in a Crowded Market
The Ghibli AI trend lets freelancers emphasize storytelling as a unique selling point. Network with creative sectors, animation studio,s and ad agencies who value innovative AI data visualization.
Ethical Freelancing
Stay mindful of ethics. Avoid copying Ghibli’s style outright to respect Ghibli’s AI copyright concerns; instead, use its warmth as inspiration. Protect client data, ensuring responsible AI storytelling.
Try This: Design a Ghibli-inspired data visualization freelance piece for your next gig, like a revenue chart styled as a flowing river. Share it on social media platforms.
Conclusion
The Ghibli AI trend proves that storytelling is the heart of impactful data science. By embracing Ghibli’s emotional depth, visual harmony, and simplicity, data scientists and analysts can transform complex insights into authentic narratives. Whether it’s a glowing dashboard or a flowing revenue chart, blending creativity with data creates experiences that inform and inspire.
Platforms like Pangaea X are making this creative leap even more accessible. By connecting freelance data scientists with global opportunities, Pangaea X empowers professionals to bring data storytelling into client projects, standing out with visuals that spark both clarity and imagination. As we explore the future of generative AI, let’s balance creativity with responsibility, respecting both artistic legacies and data ethics.

Get your data results fast and accelerate your business performance with the insights you need today.