
Hire Freelance Data Visualization Experts
Access the Largest Pool of AI-Powered Data Visualization Experts to Transform Your Data Storytelling.
What Are the Benefits of Data Visualization for Your Business?
Data is king, but raw data can be overwhelming and hard to grasp. This is where data visualisation comes in. Pangaea X freelance data visualisation experts transform your data into clear, compelling visuals that unlock hidden insights and empower smarter business decisions.
AI in Data Visualization:
With the advent of data visualization AI, the process of visualizing data becomes more efficient and insightful. Incorporating AI and data visualization allows for predictive patterns, automates the creation of visualizations, and even suggests the most effective visual formats based on data characteristics. Combining of AI with data visualization helps uncover nuanced insights, enhance predictive analytics, and personalize visualizations to meet specific business needs, making complex data more accessible and actionable. To make the most of these benefits, hiring data visualization freelancers with ai expertise is a great way to get customized and effective solutions.
")
Here’s how data visualisation benefits your business:
- Clarity and Communication: Replace complex spreadsheets and tables with charts, graphs, and maps that everyone can understand. This fosters better communication across departments and with stakeholders.
- Uncover Trends and Patterns: Visualisations reveal trends and patterns hidden within your data. See customer behaviour shifts, identify sales performance outliers, and track campaign effectiveness at a glance.
- Informed Decision-Making: Data visualisations present information in a way that facilitates clearer analysis and faster decision-making. Base your strategies on concrete evidence, not just intuition.
- Enhanced Storytelling: Data visualisations are powerful storytelling tools. Use them to present findings to clients, investors, or your team in a way that captures attention, resonates emotionally, and drives action.
- Increased Engagement: People are naturally drawn to visuals. Data visualisations make your reports and presentations more engaging, leading to better information retention and understanding.
- Improved Efficiency: Spend less time explaining data and more time taking action. Visualisations allow you to quickly identify areas needing attention and prioritise resources effectively.
- AI Tools and Automation: Using AI tools makes data visualization even more powerful. It can automate data analysis, suggest the best visual formats, predict trends, and customize visuals for specific needs. This not only saves time but also ensures that your visualizations are accurate, efficient, and tailored to your business goals.
How Do Pangaea X Freelancers Deliver Custom Data Visualization Solutions?
- Choose the right visualisation format: From bar charts to heatmaps to interactive dashboards, we select the most impactful visual for your data story.
- Design with clarity and impact: Our experts ensure your visualisations are aesthetically pleasing, easy to understand, and optimised for the intended audience.
- Leverage AI for enhanced insights: We integrate data visualization AI to automate and personalize the visualization process, enhancing predictive analytics and providing deeper insights into your data.
- Tell a compelling data story: We don’t just present data; we craft a narrative that drives insights and inspires action.
Why Choose Pangaea X as your Trusted Partner?

Quality & Verified Talent

Project Matching Expertise

Streamlined Workflow

Cost-Effectiveness

Scalability and Flexibility
Data Visualization Freelancers Ready to Work
Ready to work with the best? Find your data visualisation freelancers match on Pangaea X
Recognized By


Related Articles

How AI-Evaluated Data Competitions Go Beyond Leaderboard Scores
Introduction Data competitions traditionally follow a familiar model. Participants receive a…
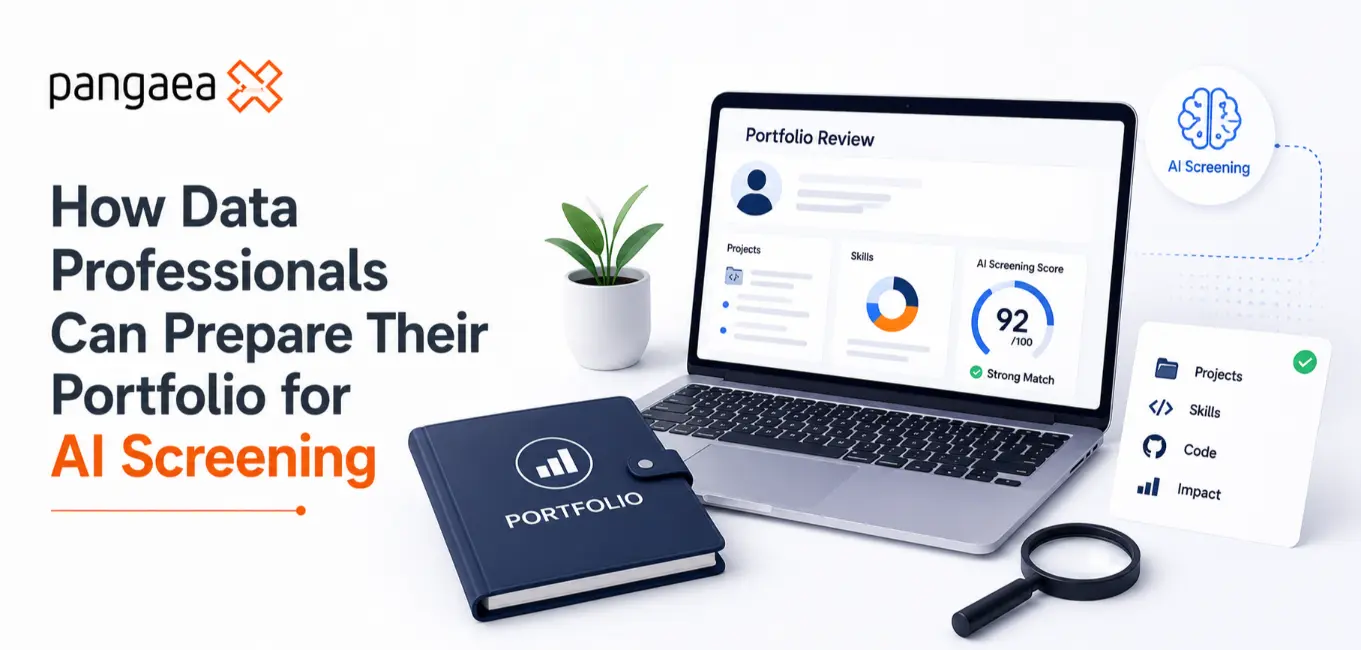
How Data Professionals Can Prepare Their Portfolio for AI Screening
Introduction A few years ago, preparing a data portfolio meant making sure your GitHub…
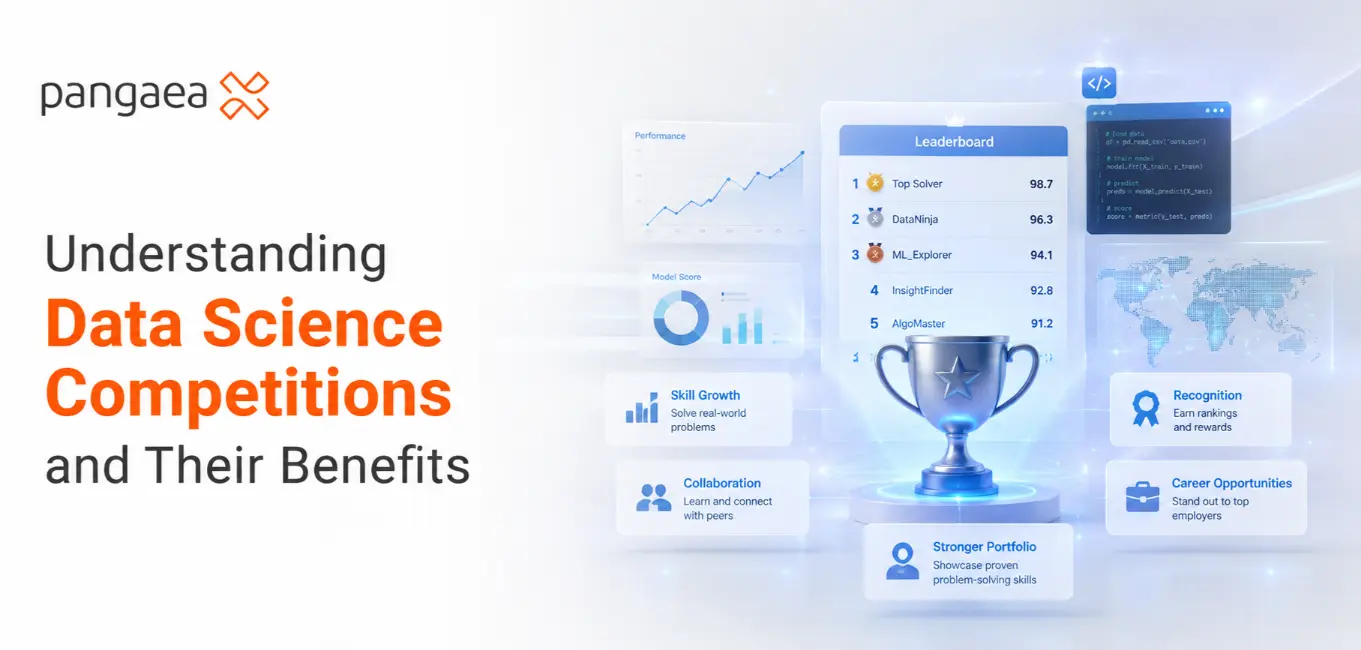
Understanding Data Science Competitions and Their Benefits
Introduction Data science as a discipline has always had a practical problem. The gap…
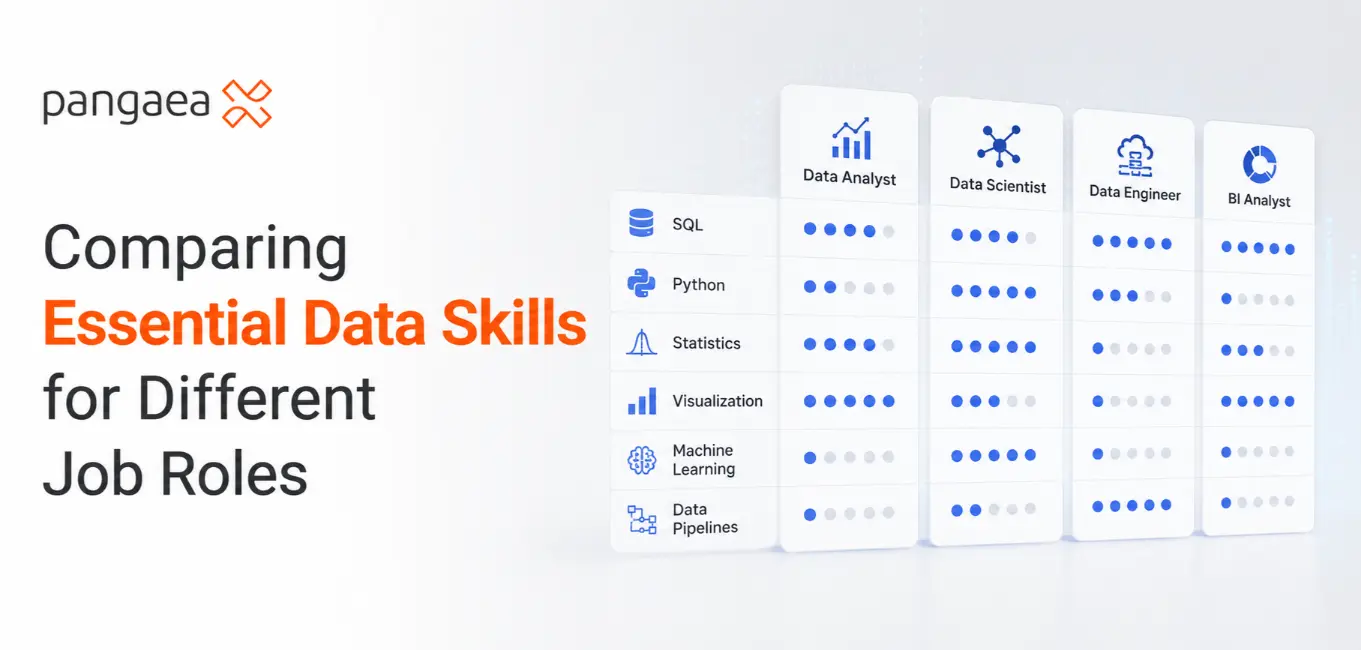
Comparing Essential Data Skills for Different Job Roles
Introduction The data field has never had one job title. It has always been a collection of…
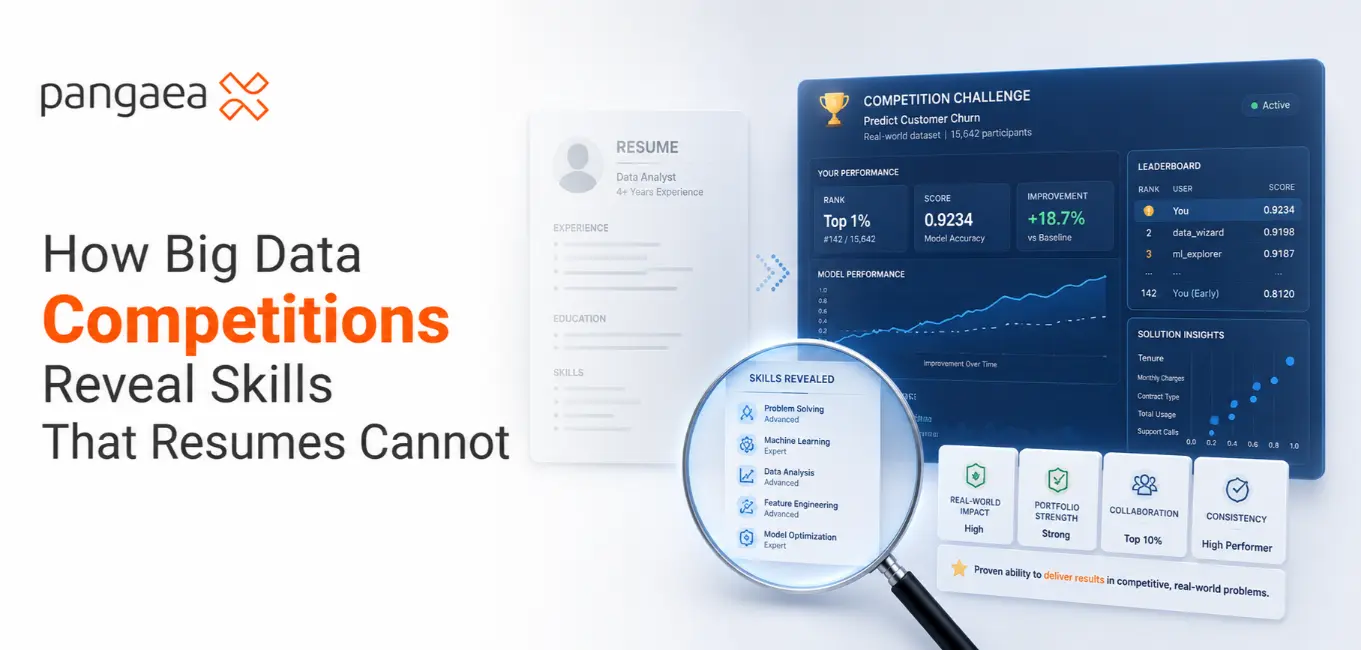
How Big Data Competitions Reveal Skills That Resumes Cannot
Introduction A resume tells an employer what you say you can do. A data competition…

Skill Authentication for Python Data Analysts: What Should You Showcase?
Introduction Python has become the dominant language in data analytics. It sits in over 31%…

AI-Led Interviews for Data Professionals: How Natural Conversations Can Reveal Real Skills
Introduction For most of the last decade, skill assessment in data hiring followed a…

How to Start Your Freelance Data Analyst Career
Introduction The appeal of freelancing as a data analyst is straightforward. You work on…

How Data Competitions Are Becoming a Hiring Tool for Data Teams
Introduction Hiring data talent has always been harder than it looks on paper. Resumes are easy to…
Frequently Asked Questions
What types of data visualisation projects can freelance specialists handle on your platform?
Our platform connects you with a talented pool of freelance data visualization experts, equipped to tackle a wide range of projects. Whether you need to transform raw data into clear insights or craft compelling narratives for your audience, our specialists have the skills and experience to bring your vision to life. They are adept at using AI visualization tools to enhance their work, making data analysis and visualization more efficient and insightful through AI-driven predictive patterns and automated visual format suggestions.
What are the key benefits of hiring a freelance data visualisation expert compared to an in-house team?
Here are the key benefits of hiring a freelance data visualisation expert compared to an in-house team, focusing on flexibility, cost-effectiveness, and access to specialised skills:
-
Flexibility:
You can easily scale your data visualization needs by hiring freelancers for specific projects. -
Cost-Effectiveness:
Freelancers typically charge an hourly or project-based rate, allowing you to pay only for the expertise you need. -
Access to Specialised Skills:
Freelancers often specialize in specific data visualization techniques or industries, bringing a unique skillset to your project.
What are the typical pricing structures for freelance data visualisation experts?
Pricing Models for Freelance Data Visualization Experts:
- Hourly Rates:
This is a straightforward approach where the expert charges a set fee per hour of work. Rates can vary depending on experience, location, and project complexity. - Project-Based Fee:
This involves quoting a fixed price for the entire project. This is beneficial for both freelancer and client as the total cost is known upfront. - Retainer Agreements:
A retainer agreement can be a valuable option for both Client and a freelance data visualisation expert. It establishes an ongoing working relationship with a set fee for a predetermined amount of work or time commitment.
What is the average turnaround time for data visualisation projects?
It’s important to note that there’s no single “average” turnaround time for data visualisation projects. The timeframe can vary greatly depending on several factors:
- Project Complexity
- Data Availability & Quality
- Scope of Work & Deliverables
- Freelancer Experience & Availability
- Communication & Collaboration
Here’s a general guideline to consider:
-
Simple Projects:
1 week – 2 weeks -
Moderate Complexity Projects:
2 weeks – 4 weeks -
Highly Complex Projects:
4+ weeks
How can freelance data visualisation experts add value to my business beyond creating visuals?
Freelance data visualisation experts can add significant value to your business beyond simply creating visually appealing charts and graphs. Here’s how:
-
Data Storytelling & Communication:
They can help transform complex data sets into compelling narratives that resonate with your audience. Utilizing AI data visualization, they can uncover deeper insights and present them in a way that engages and informs. -
Strategic Guidance & Expertise:
Data visualizations can reveal hidden patterns and trends that can inform future strategies. A skilled freelancer, acting as a data expert, can interpret these insights with the help of AI tools, providing predictive analytics and actionable recommendations for your business. -
Flexibility & Scalability:
Freelancers provide the ultimate in flexibility and scalability for your data visualization needs. You can hire them for short-term tasks, ongoing projects, or anything in between, and their skillsets, including knowledge of AI visualization tools, can adapt to the specific tools and industry knowledge your project demands.
Other skills we offer
Unlock the Power of Data with Pangaea X
Don’t let valuable data sit idle. Partner with Pangaea X to find the perfect freelance data analyst and transform your business with the power of data analysis.