
Introduction
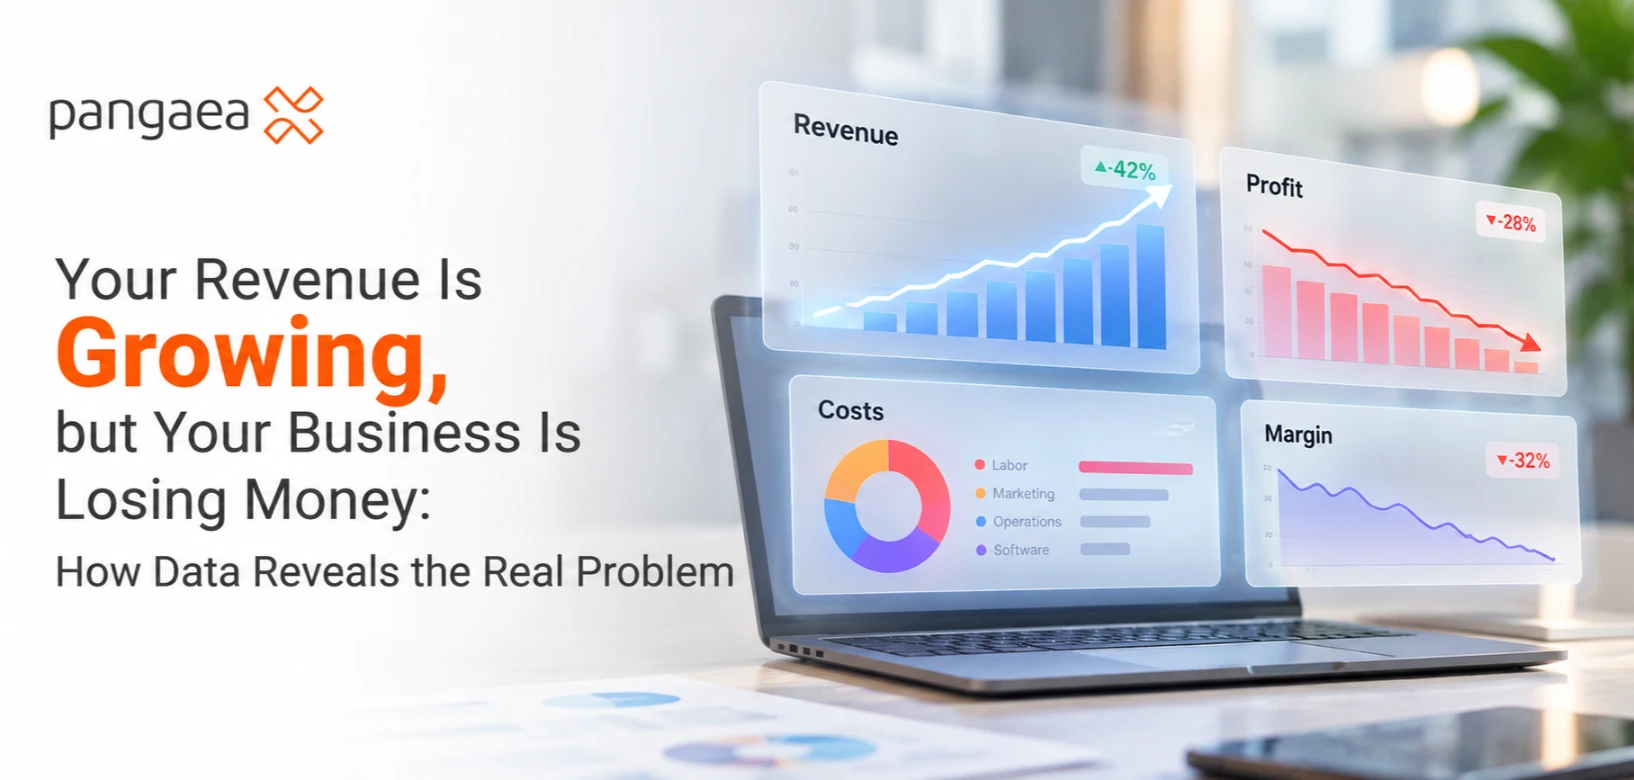
Sales are up. Orders are increasing. The latest campaign appears to be working. Then the finance report arrives, showing that operating profit has turned into a loss.
How can both results be true?
Revenue measures sales, while profitability depends on what remains after the associated costs. Growth can increase demand for products with thinner margins, raise fulfilment expenses and require more marketing investment.
Understanding the difference requires connecting sales performance with the economics behind each order. A worked example shows how to investigate the problem and turn the findings into decisions.
Why Revenue Growth Can Hide Falling Profitability
Three measures help explain what is happening:
- Net revenue: sales after discounts, returns and allowances.
- Gross profit: net revenue minus the cost of goods sold.
- Operating profit: gross profit minus the remaining operating expenses, before interest and income taxes.
Cash flow requires a separate assessment because the timing of customer payments, inventory purchases and other transactions affects available cash.
Assessing revenue growth alongside profitability helps teams understand how much value additional sales contribute.
The Business Case: Sales Rise, but an Operating Loss Appears
Consider a fictional online retailer comparing two months.
All figures below are illustrative, in USD. Net revenue already reflects discounts and refunds. Each cost appears once, with other operating expenses including applicable depreciation.
| Metric | Month 1 | Month 2 |
| Orders | 2,000 | 2,500 |
| Net revenue | $100,000 | $125,000 |
| Cost of goods sold | $55,000 | $75,000 |
| Gross profit | $45,000 | $50,000 |
| Fulfilment and transaction costs | $10,000 | $15,000 |
| Marketing costs | $15,000 | $25,000 |
| Other operating expenses | $12,000 | $14,000 |
| Operating profit / loss | $8,000 | −$4,000 |
Revenue increased 25%, but total operating costs increased by $37,000 against only $25,000 in additional revenue. Operating profit therefore declined by $12,000.
Gross profit actually increased by $5,000. However, gross margin fell from 45% to 40%, and the additional gross profit could not cover the higher operating expenses.
The next question is specific: which changes in products, order economics and spending explain that movement?
Bring Sales and Cost Data Into the Same Analysis
Start by assembling the records needed to follow an order from sale to contribution:
| Data | What it helps explain |
| Order ID, date, product and quantity | Where sales growth originated |
| Selling price, discounts and refunds | Revenue retained from each sale |
| Product cost | Gross profit by product |
| Delivery and transaction charges | Variable cost of serving orders |
| Customer, campaign and channel records | Acquisition and repeat-purchase patterns |
Use consistent reporting periods and currencies. Reconcile the totals with finance records before interpreting differences. Match refunds to the reporting policy, and use the cost of goods actually sold when calculating gross profit.
Pay particular attention to table relationships. Joining one order to several product rows can repeat its delivery charge. Similarly, monthly campaign spend can be duplicated if attached to every order without an allocation method.
Find What Is Driving the Profit Decline
Product Mix and Discounts
In the sample order data, both product groups generate $50 net revenue per order. One has a $20 product cost, leaving $30 gross profit. The lower-margin group costs $40, leaving $10.
Orders for the higher-margin group remain at 1,250. Lower-margin orders increase from 750 to 1,250, accounting for all 500 additional orders.
That explains the $25,000 revenue increase and just $5,000 additional gross profit. Product prices and unit costs are unchanged in this example, so the margin decline comes from the changing sales mix.
For an actual business, compare realised prices, discounts and unit costs within each product to separate pricing changes from mix changes.
Fulfilment Cost per Order
Average fulfilment and transaction cost rises from $5 to $6 per order.
Of the $5,000 total increase, $2,500 comes from serving 500 additional orders at the original $5 rate. The remaining $2,500 reflects the higher average cost across all 2,500 orders.
Investigate shipment size, split deliveries, service levels, carrier charges and transaction fees to explain that rate change.
Marketing Spend and Customer Contribution
Marketing spending rises by $10,000, while gross profit grows by $5,000. Other operating expenses add another $2,000.
Together with the fulfilment increase, these changes reconcile the entire profit decline:
$8,000 + $5,000 − $5,000 − $10,000 − $2,000 = −$4,000.
To evaluate marketing decisions, compare each channel’s contribution after product and fulfilment costs with its marketing spend. Examine new and returning customers separately.
Some acquisition investment may generate later repeat purchases. Assess those customer groups over a consistent period before judging their longer-term value. The monthly totals explain the current loss; customer-level evidence determines whether that investment is justified.
Work Through a Practical Improvement Scenario
The analysis points to three areas worth testing: realised selling prices, fulfilment efficiency and marketing allocation.
Suppose the retailer models these changes:
| Proposed change | Calculation | Monthly improvement |
| Adjust selected offers | $3 more net revenue on 1,000 orders | $3,000 |
| Reduce average fulfilment cost | $0.80 saved across 2,500 orders | $2,000 |
| Remove ineffective marketing spend | Reduce spending from $25,000 to $23,000 | $2,000 |
| Combined improvement | $7,000 |
The model moves operating profit from a $4,000 loss to a $3,000 profit:
$128,000 revenue − $75,000 product costs − $13,000 fulfilment − $23,000 marketing − $14,000 other expenses = $3,000.
This is a scenario, with explicit assumptions: order volume and product mix stay constant, refunds remain stable, and implementation adds no extra cost.
Those assumptions need testing. Higher prices or reduced advertising could lower demand. Cheaper fulfilment could affect delivery quality. Any resulting changes must flow back into the calculation.
For example, a 10% volume decline with the same mix and per-order economics would reduce contribution before marketing and other expenses from $40,000 to $36,000. If those remaining expenses stayed at $37,000, the model would return to a $1,000 operating loss.
Use an A/B test to compare the existing offer with the proposed version. Define the eligible audience, randomise appropriately and measure contribution per eligible visitor alongside conversion and refunds. This captures whether improved order margins compensate for any reduction in purchases.
Give each action an owner and a review date. Finance should validate the combined result so that overlapping savings are counted once.
Track Whether Growth Is Becoming More Profitable
Build a recurring review around a small set of connected measures:
- Operating profit and margin: whether the business is improving overall.
- Gross margin by product group: whether the sales mix is changing.
- Contribution per order: net revenue minus product, fulfilment and transaction costs in this model.
- Acquisition cost and repeat contribution: whether customer investment pays back over the chosen period.
- Delivery performance and refunds: whether operational changes preserve the customer experience.
Review the measures together. A higher contribution per order can still accompany lower total profit if order volume falls sufficiently.
Turn the Findings Into Better Business Decisions
This case brings together data preparation, margin calculations, root-cause investigation and scenario testing. The useful output is a recommendation whose numbers, assumptions and success measures can be checked.
For analysts developing these skills, working through unfamiliar business problems provides useful practice. CompeteX is PangaeaX’s platform for practical data competitions, where participants solve structured problems and demonstrate their analytical skills. Its data analytics challenges bring together tasks such as preparing data, selecting business metrics and explaining findings.
The same approach carries into everyday business decisions: understand where growth comes from, calculate what it contributes and test how proposed changes affect profitability.