Marketing (Small Businesses)
Overview
A small business builds candles in the rural areas and ships it to the urban areas. The owner runs a number of marketing ads to get the orders up and sponsored posts on social media. The google analytics generated lot of data daily wise, weekly wise monthly wise and yearly wise. Although google analytics itself was a good tool to track the traffic, a dashboard was built to combine the sales, budget, actuals and profit numbers.
Challenge
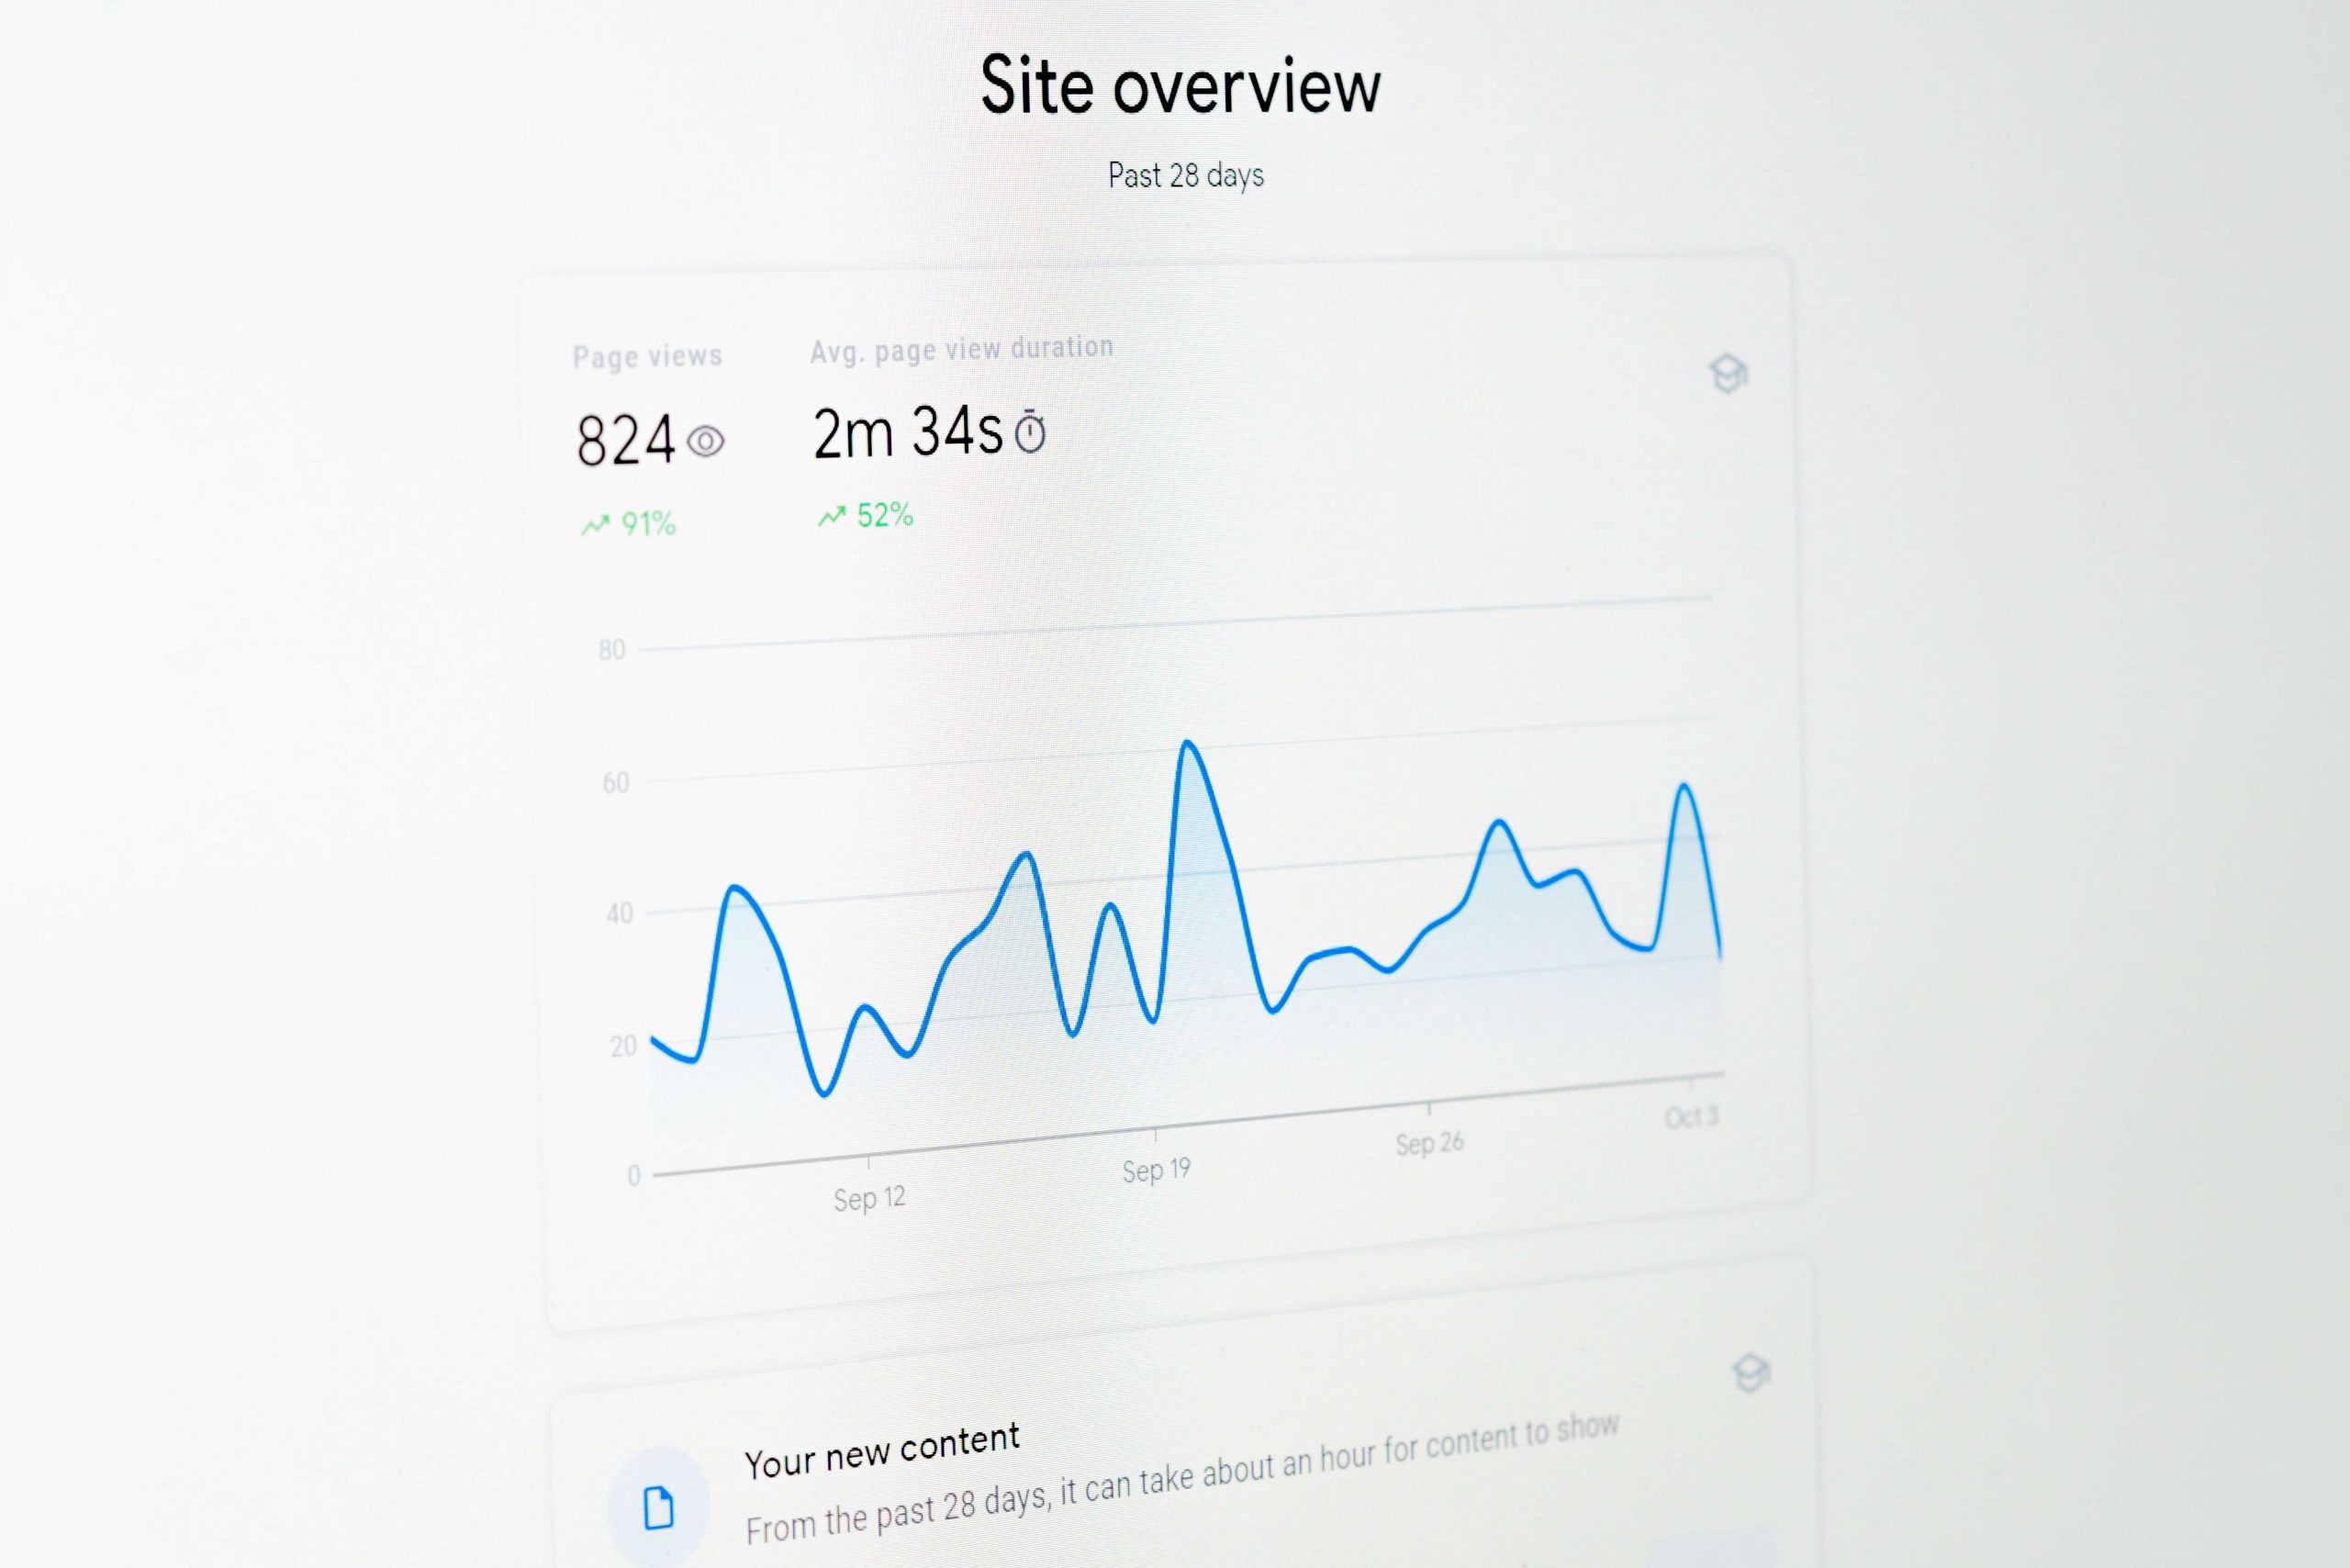
As it was a small business, no one knew what analytics mean except the owner. Only she could understand how to identify the data pain points. Google analytics extracted the traffic coming directly to the websites. There were no more dashboards. There was no way to know where the investments were made or how much was being spent.
Implementation
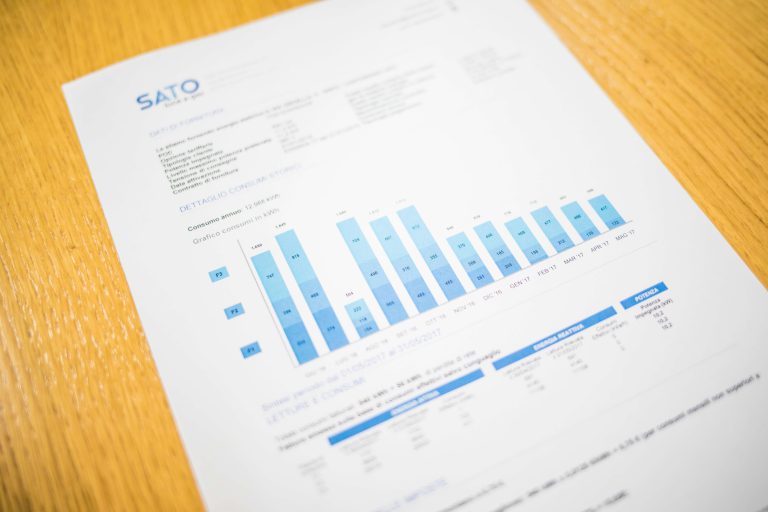
The visualisation expert firstly set the process of how the data framework will look like. Knime was used to combine all the datasets together irrespective of the formats like csv, MS access , excel etc. The budgeted numbers and the actual numbers were in the same csv. A dashboard was created with clear understanding of how much investment is already done on these campaigns and sponsored posts. Once everything was connected to one another the dashboard was created with filters and parameter control.
Benefits Achieved
- Increase in sales by 2%.
- Automated reporting
Generating insights and outliers in everyday report


Get your data results fast and accelerate your business performance with the insights you need today.